1.75 Million GPS Data Points Exposed What Really Happens to Financed Vehicles in West Africa
In emerging markets, vehicle-backed lending carries a risk that spreadsheets cannot quantify: the moment a borrower drives off the lot, the lender loses visibility. No quarterly financial statement will tell you that a financed truck stopped moving two weeks ago, or that a collateralized car is now operating 300 km outside its agreed zone. For microfinance institutions and auto lenders in West Africa, this blind spot is not theoretical. It is where defaults begin.
We set out to measure what GPS telematics actually reveals when deployed on a live lending portfolio. Working with a leading West African microfinance institution, we analyzed 30 days of anonymized production data from a GPS-tracked fleet of financed vehicles. The results tell a clear story about collateral risk, borrower behavior, and the operational intelligence that telematics unlocks.
What the Fleet Told Us in 30 Days
The numbers surprised us. The tracked fleet generated 1,748,179 GPS position records in a single month, an average of 58,000 data points per day flowing into the platform. Each record carries latitude, longitude, speed, heading, ignition state, and battery level. That is not a periodic check-in. That is a continuous, second-by-second portrait of every financed asset in the portfolio. For a broader look at what telematics can do, see our guide to GPS tracking benefits.
The institution tracks a mixed collateral portfolio spread across multiple lending branches:
| Vehicle Type | Share |
|---|---|
| Car | 43% |
| Pickup | 22% |
| Truck | 17% |
| Motorcycle | 17% |
This mix reflects a typical micro-lending portfolio: collateral ranging from commercial trucks to personal motorcycles used for income generation.
Telemetry Volume
| Metric | Value |
|---|---|
| Total GPS fixes (30 days) | 1,748,179 |
| Average positions per day | 58,273 |
| Peak positions (single day) | 69,610 |
| Positions per vehicle per day | 2,534 |
Trip Frequency
The fleet recorded 3,427 ignition-based trips over 30 days, averaging ~5 trips per vehicle per day. These vehicles are working. For a lender, that single metric, trips per day, is a behavioral proxy for cash flow. A vehicle making 5 daily trips is a vehicle generating income for its owner, and income is what services debt.
| Metric | Value |
|---|---|
| Median trip duration | 14 minutes |
| Average trip duration | 31 minutes |
| 90th percentile (P90) | 68 minutes |
| Longest trip | 23.3 hours |
The median trip of 14 minutes reflects frequent short urban runs: deliveries, client pickups, market visits. The P90 at 68 minutes indicates regular intercity travel. The long tail up to 23 hours suggests occasional long-haul or overnight transport routes.
95.7% of tracked vehicles remained active throughout the 30-day observation period. 100% of vehicles were reporting within the last hour at the time of measurement.
That uptime figure matters more than it appears. A tracker that stays online means the borrower has not tampered with it, has not disconnected it, and has not attempted to obscure the vehicle's location. Near-perfect uptime is the strongest compliance signal a lender can get, and it arrives automatically, without a field agent making a single visit.
| Metric | Value |
|---|---|
| Active vehicles | 95.7% |
| Vehicles reporting in last hour | 100% |
| Vehicles offline > 24h | 0% |
Where the Collateral Actually Operates
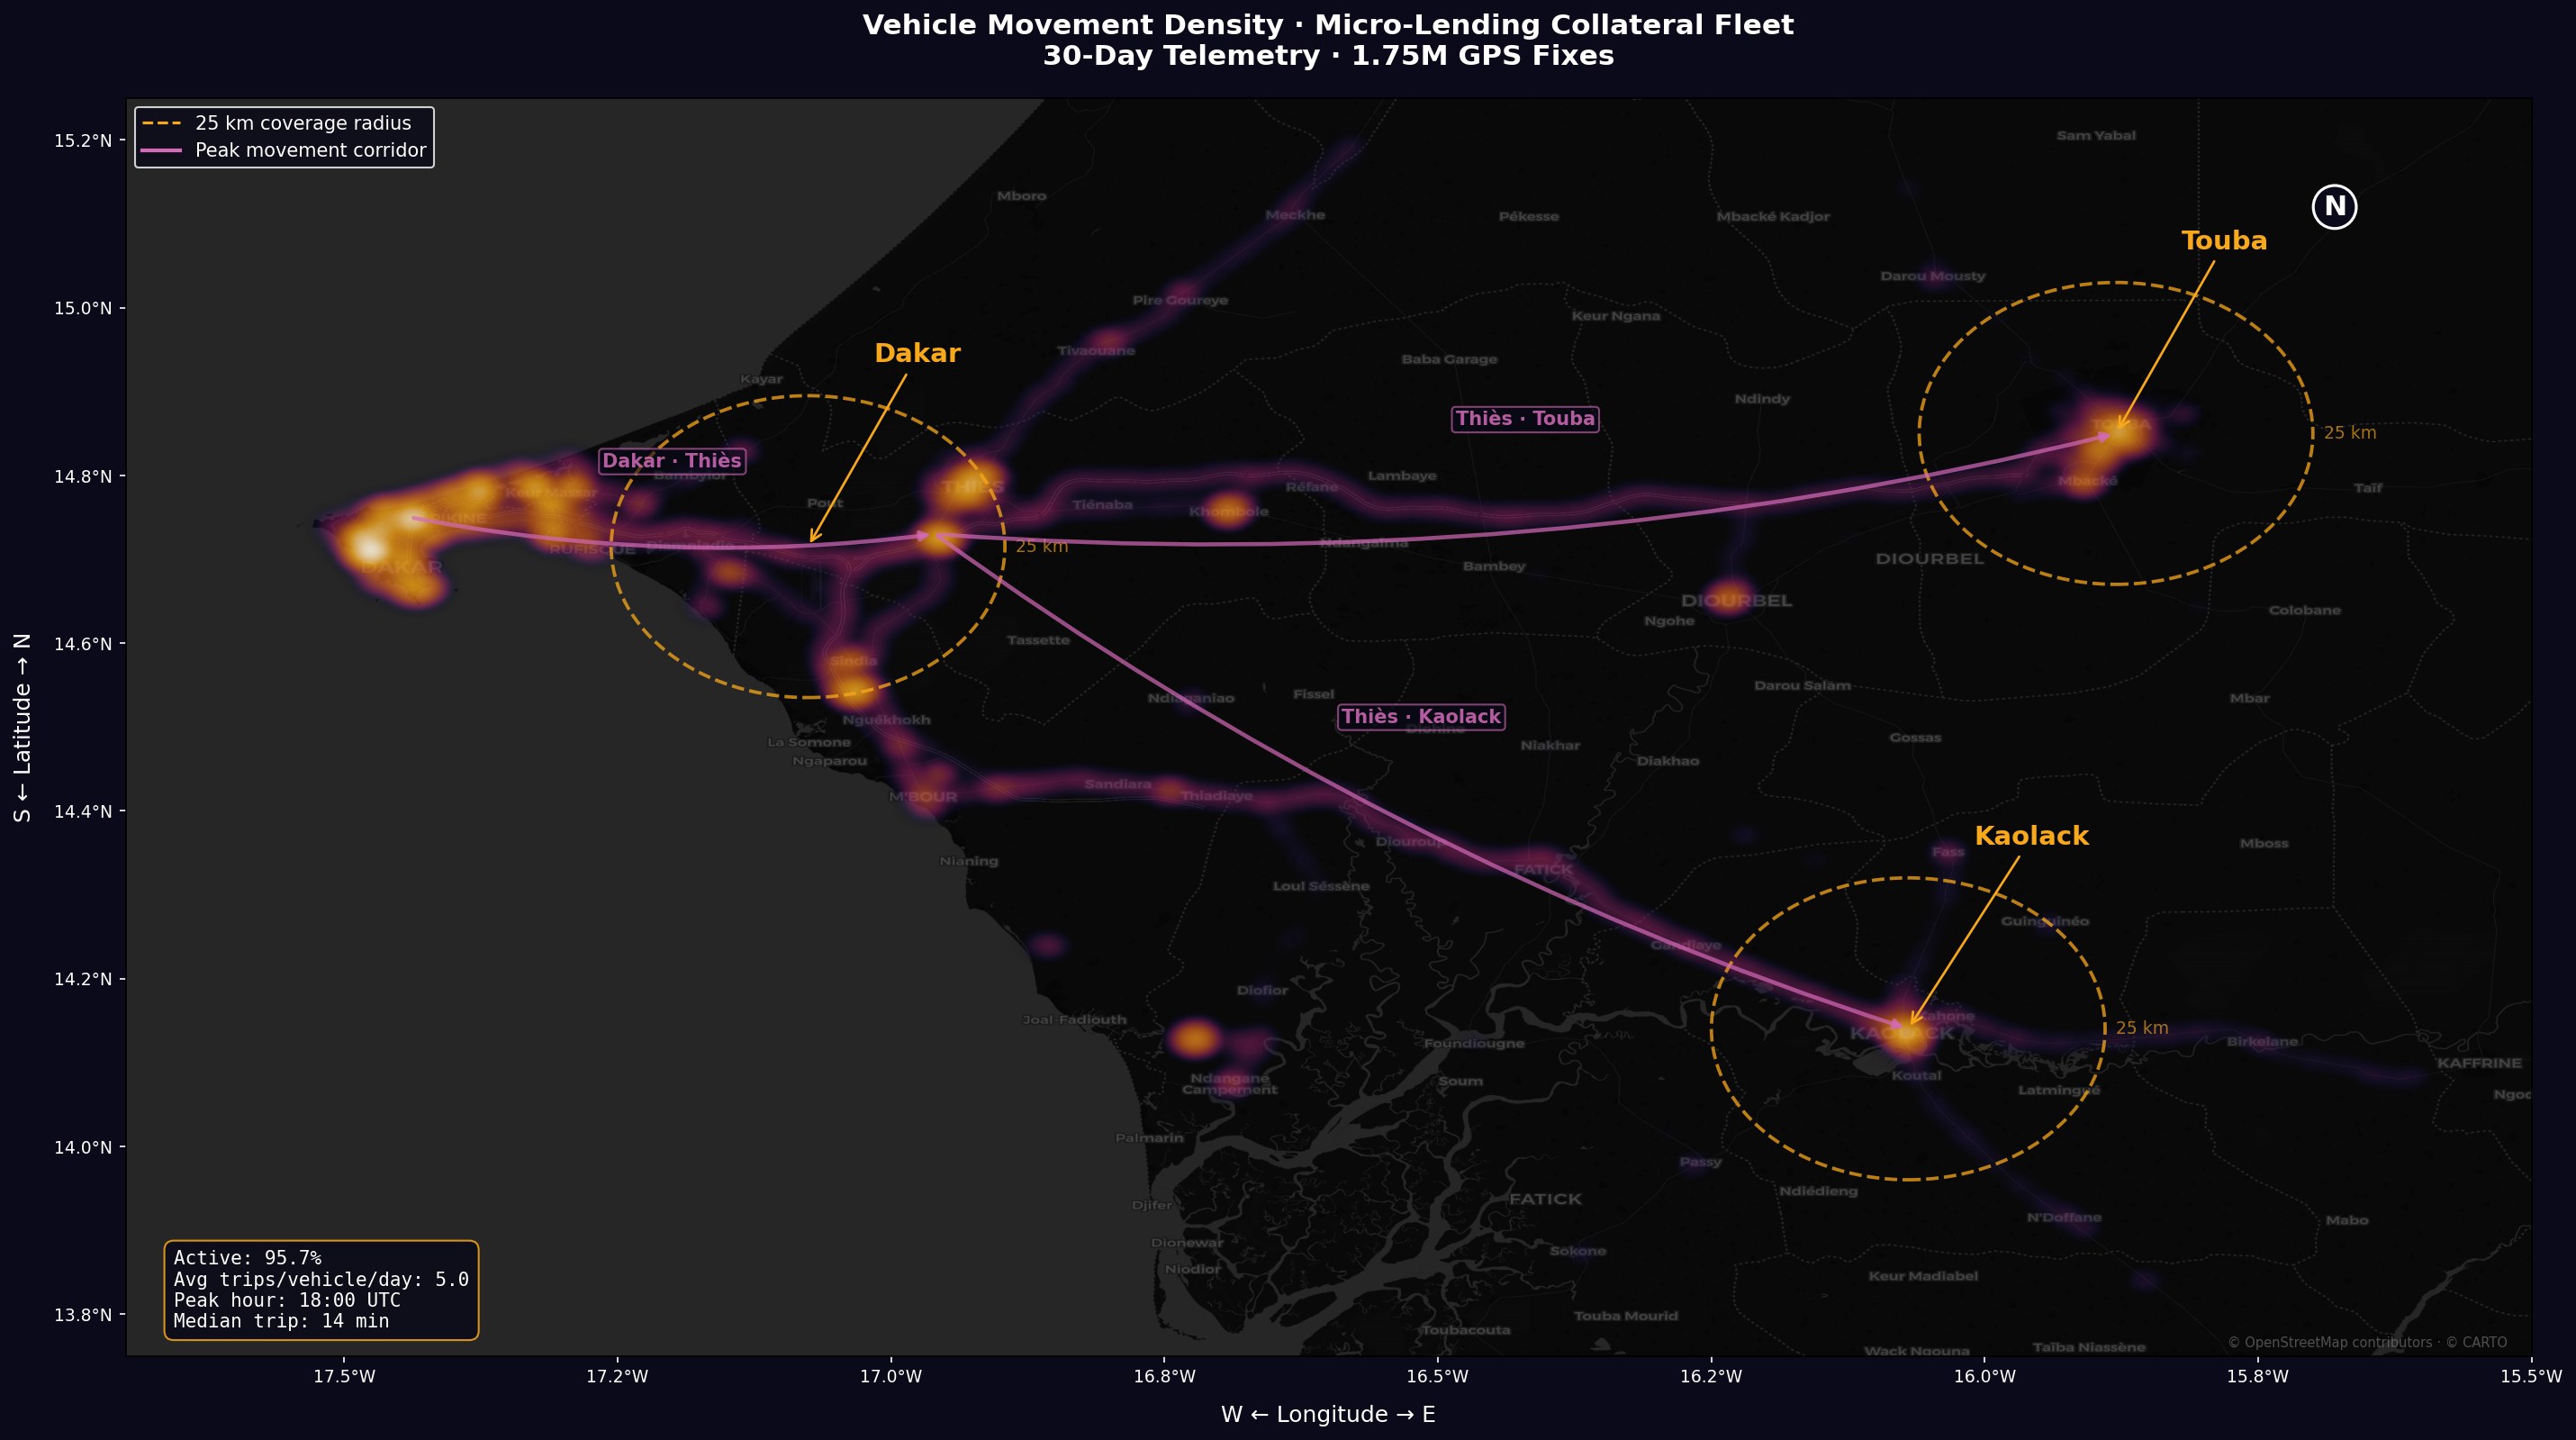
Our data revealed three distinct operational hubs connected by well-defined movement corridors. The geographic footprint spans over 400 km north to south and 270 km east to west, covering the country's primary economic arteries.
- Dakar: The densest activity cluster, accounting for over 60% of all position data. The capital and primary commercial center where most financed vehicles operate daily.
- Kaolack: A secondary hub 150 km southeast of Dakar, serving as a regional trade and agricultural logistics center.
- Touba: Located 180 km east, this hub shows consistent activity tied to trade routes and periodic commercial surges around the country's second-largest city.
Peak Movement Corridors
Three dominant corridors connect the hubs:
- Dakar · Thiès: The most trafficked route, carrying daily commercial traffic between the coast and the inland junction city of Thiès.
- Thiès · Kaolack: A southern route serving agricultural logistics and regional trade.
- Thiès · Touba: An eastern route with periodic traffic spikes aligned with commercial and religious events.
For lenders, this geographic intelligence answers a critical question: is the vehicle operating where the borrower said it would? A financed vehicle that suddenly stops appearing in its usual corridors, or begins operating in an unexpected region, is an early warning signal. Geofencing makes zone compliance enforceable, not just observable. When a vehicle crosses a boundary, the lender knows immediately, not at the next quarterly review.
We observed only 3 geofence exits across the entire fleet in 30 days. Borrowers overwhelmingly stayed within their agreed operating zones.
The Clock Tells a Story Too
The fleet exhibits a clear bimodal activity pattern consistent with commercial vehicle operations:
| Time (UTC) | Positions | Context |
|---|---|---|
| 07:00 | 110,319 | Morning departure, start of business day |
| 13:00 | 108,083 | Midday peak, deliveries and client visits |
| 18:00 | 145,646 | Peak hour, evening rush and return trips |
| 05:00 | 23,679 | Overnight low (expected for commercial fleet) |
The 18:00 peak (145K positions) is 6x the overnight low (24K at 05:00), confirming strong daytime commercial utilization. Night-time activity remains non-zero, indicating some vehicles operate evening shifts or long-haul routes.
The pattern itself is the insight. A vehicle that shifts from daytime commercial use to erratic night-time activity is a vehicle whose circumstances have changed. A vehicle that goes silent during business hours was not silent voluntarily. These pattern shifts surface in telematics data days or weeks before they surface in a missed payment.
Activity Scoring: Quantifying Collateral Health
Raw telemetry is powerful, but lenders need a single, actionable metric. Traxelio's Activity Score compresses seven days of vehicle behavior into a 0-100 rating built on three weighted factors:
| Factor | Weight | Benchmark | What it measures |
|---|---|---|---|
| Days active | 40 pts | 7/7 days with ignition events | Regularity of vehicle use |
| Distance traveled | 30 pts | 500 km/week | Operational reach and commercial activity |
| Drive time | 30 pts | 4 hours/day average | Intensity of daily use |
A vehicle scoring 100 was active every day, drove a meaningful distance, and logged substantial drive hours. A vehicle at 0 has not moved in over a week.
How the Portfolio Scored
We computed activity scores across the entire lending fleet. The results:
| Rating | Score Range | Share of Fleet | Interpretation |
|---|---|---|---|
| Healthy | 70-100 | 86% | Active, revenue-generating, low default risk |
| Warning | 40-69 | 0% | Reduced activity, monitor closely |
| Critical | < 40 | 14% | Inactive or near-inactive, immediate attention |
86% of financed vehicles scored Healthy, with a fleet-wide average of 86.2 and a median of 100. The 14% in Critical status flagged two clear cases: one vehicle inactive for 142 days (likely repossession candidate), another idle for 11 days (potential early default signal).
For a lender, this scoring framework automates what field agents cannot do at scale: continuously rate every vehicle in the portfolio, flag the ones that stop working, and do it daily without a single site visit. The score updates every 24 hours, making it a living risk metric rather than a quarterly snapshot.
What This Means for Lenders
GPS telematics converts a static asset (a vehicle on a loan agreement) into a live data stream that reveals borrower behavior in ways financial statements cannot.
Boundary Enforcement and Alert Events
Our data logged a significant volume of actionable events over the 30-day window:
| Event Type | Count (30 days) | Implication |
|---|---|---|
| Alarms triggered | 1,606 | Active monitoring of speed, movement, and curfew violations |
| Geofence exits | 3 | Rare but detectable unauthorized zone departures |
| Crash events | 12 | Moderate collision exposure across the portfolio |
| Vehicle downtime alerts | 45 | Extended idle periods flagged automatically |
Each of these is actionable intelligence that a lender without telematics would simply never see.
Inactivity Detection: Automated Early Warning
When a financed vehicle stops moving, the clock starts ticking on a potential default. Traxelio's Vehicle Downtime monitoring tracks every vehicle's idle state and triggers automated alerts when inactivity crosses a configurable threshold, by default 3 days.
In this portfolio, 82% of vehicles had zero downtime days. The system flagged the remaining 18% automatically, generating alerts that gave the collections team a multi-week head start over traditional payment-based detection.
The mechanism is simple but powerful: a borrower who is about to default often stops using the vehicle before they stop paying. The vehicle goes quiet first. Inactivity detection catches that silence in real time, converting a passive asset into an active early warning system.
Deterrent Effect: Remote Immobilizer
The remote immobilizer capability deserves separate mention. The ability to remotely disable a vehicle's engine in cases of default or unauthorized use changes the entire risk dynamic. In practice, we find the kill switch is rarely activated. Its power is in deterrence: borrowers who know their vehicle can be immobilized have a strong incentive to stay compliant. The threat reshapes behavior before enforcement becomes necessary.
Risk Scoring with Telematics
Taken together, these signals allow lenders to build a telematics-based risk score that supplements traditional credit assessment:
| Signal | Healthy | Warning | Critical |
|---|---|---|---|
| Activity Score | 70-100 | 40-69 | < 40 |
| Vehicle uptime | > 95% | 80-95% | < 80% |
| Trips per day | > 3 | 1-3 | < 1 |
| Geofence compliance | 0 exits | 1-2 exits/month | 3+ exits/month |
| Trip pattern consistency | Stable corridors | Minor shifts | Operating area change |
| Downtime days | 0 | 1-3 | 4+ |
A borrower who scores well on all six dimensions is a borrower whose collateral is verifiably active, located, and compliant. A deviation on any dimension is an early warning that arrives weeks before a payment is missed, giving collections teams an intervention window that manual monitoring cannot provide.
Three Takeaways for Financial Institutions
1. Vehicle collateral is only as safe as your visibility over it. With 1.75 million data points per month, telematics replaces manual spot checks with continuous, automated monitoring. The question is no longer can we afford to track? It is can we afford not to?
2. Activity scoring and inactivity detection are leading indicators of loan health. 86% of this fleet scored Healthy on the Activity Score. The 14% in Critical were flagged automatically, weeks before any payment was missed. Combined with trip frequency and uptime data, lenders get a multi-dimensional early warning system.
3. Deterrence is cheaper than recovery. A single unrecovered vehicle is a total loss of loan principal. GPS tracking with remote immobilization, geofencing, activity scoring, downtime detection, and live alerts costs a fraction of one default while improving compliance across the entire portfolio. For a deeper look at vehicle security capabilities, see our anti-theft and vehicle security guide.
This analysis is based on anonymized production data from a GPS telematics deployment in the West African micro-lending sector. No client names, account identifiers, or personal data were used in this report. All fleet metrics are expressed as percentages or averages to preserve anonymity.
If you manage a vehicle-backed lending portfolio and want to see what your data looks like, let's talk.
